تحلیل تکنیکال GoldMasterTrades درباره نماد TON : توصیه به خرید (۱۴۰۴/۹/۱۶)

GoldMasterTrades
تحلیل TONUSDT: ریزش نزولی و فرصت تست مجدد کوچک!
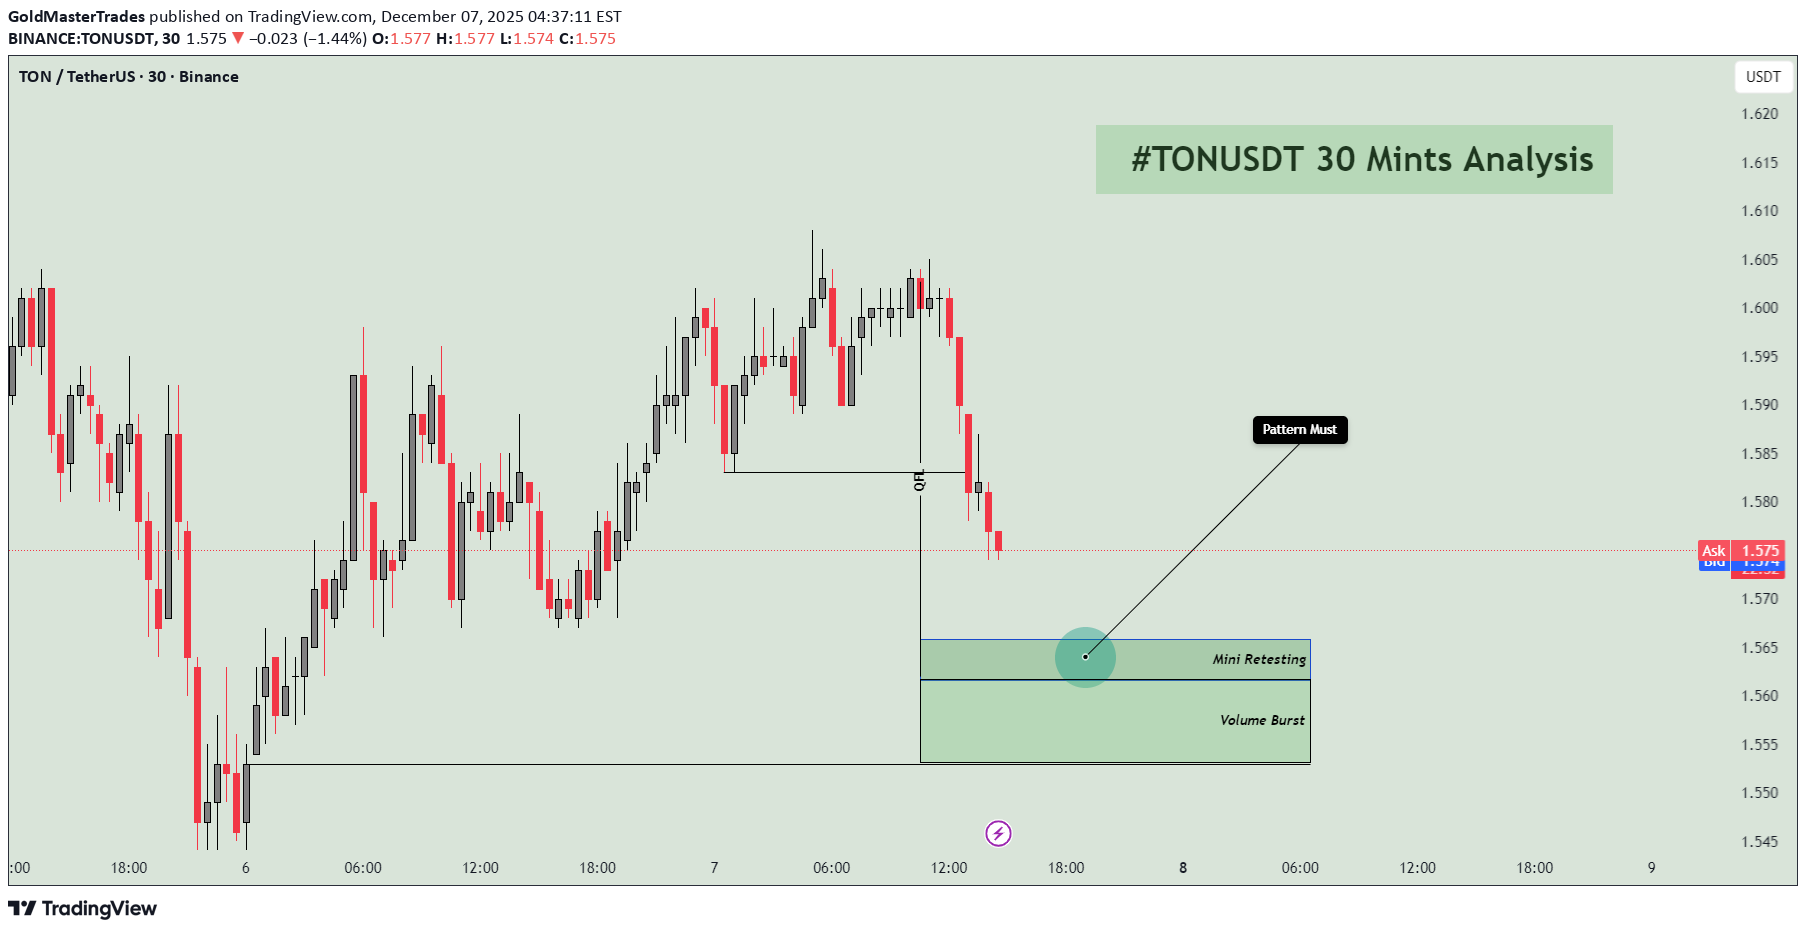
TONUSDT 30-Minute Chart Analysis: Bearish Breakdown with Mini Retest Potential The analysis hints at a bearish continuation after a volatile upswing, with annotations suggesting a "Pattern Must" (possibly "must fail" or "must hold") and a "Mini Retesting" zone where price might stabilize before deciding direction. I'll expand on this below in a TradingView Idea-style format, adding more depth with historical context, pattern implications, and broader market ties for TON in late 2025. Chart Overview The x-axis displays time in 6-hour increments from 06:00 on December 6 onward, covering intraday swings into December 7 and projections to December 9. The y-axis scales prices from about 1.545 to 1.625 USDT, with the ask price marked at 1.577 (red) and bid at 1.576 (blue? – appears as "Ask 1.577 Bid 1.576"). Candlestick Sequence: Starting left, there's a bearish drop with red candles, followed by a sharp bullish rally (green candles climbing to ~1.615 around December 6, 18:00). This peaks and reverses with a cluster of red candles, forming a top around December 7, 06:00. Post-peak, price consolidates with smaller mixed candles, then drops sharply near the center, labeled "Pattern Must." The right side shows fading momentum, with a projection line sloping downward. Trendline and Projections: A descending black trendline from the peak projects future downside, pointing toward lower levels by December 8–9. This acts as resistance, with price hugging it during the decline. Key Annotations: "Pattern Must": Labeled with an arrow at a sharp drop around 1.585, suggesting a critical pattern (e.g., head-and-shoulders or double top) that "must" play out bearishly. The word "Must" implies inevitability in the analyst's view, perhaps a must-fail bull trap. "Mini Retesting" Zone: A green horizontal box around 1.565–1.570, with a circle dot, indicating a minor retest of support. This could be a brief pause where price checks former resistance-turned-support. "Volume Burst": Below the retest zone, highlighting a potential surge in trading volume at lows, which might signal capitulation or accumulation. Lightning Bolt Icon: At the bottom, similar to volatility warnings, possibly denoting a high-impact event like news (e.g., Telegram ecosystem updates affecting TON). Horizontal red line at ~1.575 acts as a pivot. Overall, the chart captures TON's typical crypto volatility, influenced by factors like Telegram integrations, NFT/adoption news, or broader market correlations with BTC/ETH in 2025. Technical Analysis Breakdown Expanding on the visuals with deeper indicators and context: Trend and Momentum: The initial rally from ~1.550 (December 6) to 1.615 forms an impulsive wave, potentially Wave 3 in Elliott terms, followed by a corrective pullback. The descending trendline confirms lower highs, signaling bearish control. Momentum appears waning on the right, with smaller candle bodies – a sign of exhaustion. Support/Resistance and Zones: Resistance: Peak at 1.615 and the trendline (~1.590 declining). Breaking above could negate the bearish setup. Support: "Mini Retesting" at 1.565, with "Volume Burst" implying buyer interest. Lower supports at 1.550 (chart low) or psychological 1.500. Volume: 14.0B is substantial for TON, suggesting institutional interest; bursts at lows could indicate smart money entry. Patterns and Signals: Potential Head-and-Shoulders or Double Top: The "Pattern Must" points to a topping formation – left shoulder rally, head at 1.615, right shoulder weaker. Neckline break at ~1.585 triggers downside targets (project to 1.515, height subtracted). Retest Dynamics: The "Mini Retesting" suggests a quick backtest of the breakdown level, common in ICT (Inner Circle Trader) concepts for liquidity grabs before continuation. Projection Implications: The downward line forecasts a test of 1.545 by December 8, aligning with Fibonacci 61.8% retracement from the rally base. Broader Context: In 2025, TON has seen growth from Telegram's 900M+ users, but faces competition from Solana/ETH. Recent dips might tie to regulatory news or market-wide corrections. If indicators like RSI/MACD were overlaid (not shown), we'd likely see overbought at peaks (>70) and divergence at lows, supporting a reversal tease. Trade Idea: Short Bias with Retest Entry Leveraging the chart's bearish lean: Bearish Setup (Primary): Short on failure of "Mini Retesting" (break below 1.565). Entry: 1.564. Stop Loss: Above trendline at 1.580 (risk ~1%). Take Profit: 1.545 (initial), then 1.520 (extension). R:R 1:2+. Rationale: "Pattern Must" implies continuation, amplified by volume bursts flushing weak hands. Bullish Counter-Trade (Risky): If "Volume Burst" holds and price reclaims 1.575, long for a squeeze. Entry: Above 1.578. Stop Loss: Below 1.560. Take Profit: 1.600 (prior high). This bets on the retest as a fakeout bottom. Position Sizing: Limit to 0.5-1% risk, use leverage cautiously (e.g., 5x on Binance). Watch correlations: TON often moves with BTC; if BTC dumps, amplify downside. Always incorporate news – e.g., Telegram Wallet updates could spark reversals. Key Insights and Mindsets for Traders Drawing from TradingView wisdom and crypto trading psychology: Mindset 1: Respect the Pattern: "Pattern Must" reminds us patterns aren't guarantees but probabilities. Backtest similar TON setups historically for edge. Mindset 2: Volume Tells the Story: Don't ignore "Volume Burst" – it's where real moves start. In crypto, spikes often precede 20-50% swings; use it to confirm entries. Mindset 3: Scale Timeframes: This 30-min view is tactical; zoom to 4H/Daily for confirmation. TON's 2025 uptrend (from ~$2 earlier? – check live) might make this a dip-buy opportunity. Mindset 4: Event Awareness: The lightning bolt screams "catalyst watch." Monitor X/Telegram for TON news; volatility spikes on announcements. Mindset 5: Risk First: In volatile assets like TON, preserve capital. Use the retest zones for defined stops, avoiding emotional FOMO. This detailed breakdown positions the chart as a bearish alert with reversal caveats. For live updates, check TradingView or Binance directly. DYOR, and consider #TON #Crypto #TechnicalAnalysis for community input!